On this page
Community recovery: model scope and finite benchmark assurance
9 October 2026. Opportunity 032 is a low-confidence integration for graph analytics teams evaluating clustering workflows. The useful capability is a repeatable model/signal/algorithm review, while the Facility Plan Auditor remains the first commercial experiment. No actual customer need, paid demand or new threshold-optimal algorithm was demonstrated.
Exact scope of the three-state result
The source symmetric channel has diagonal (1+2lambda)/3, off-diagonal (1-lambda)/3 and -1/2<=lambda<=1. It treats regular b-ary trees, integer b>=2, and observed Poisson trees with mean d>1. The observation contains the unlabelled tree through a level and boundary spins; interior spins are hidden. The advantage is expected posterior total variation from uniform, averaged over trees and spins without conditioning on survival. The claimed exact threshold is d lambda^2>1, with nonreconstruction at equality.
Its graph corollary fixes positive a,b and d=(a+2b)/3>1. Each vertex label is drawn independently and uniformly among three communities. Conditional on labels, independent undirected edges have probabilities a/n within and b/n between. Thus lambda=(a-b)/(a+2b), and KS=(a-b)^2/[3(a+2b)]. The margin S=(a-b)^2-3(a+2b) determines the claimed asymptotic weak-recovery regime. The result covers both signs, but excludes a=0 and b=0; the coloring endpoint a=0,b=6 is not in this graph corollary.
At S<=0 the claim is that every graph-only estimator with independent randomization has expected best-permutation overlap tending to one-third as n tends to infinity. At S>0 an algorithm allowed to know the fixed a,b achieves overlap at least one-third plus some fixed positive epsilon with probability tending to one, in O(n log n). This neither gives a finite-n overlap guarantee nor makes every clustering algorithm successful. Weak recovery is not exact classification. Features, directed/weighted edges, unequal label probabilities, fixed-size conditioning or fitted parameters need separate scope and model analysis.
The paper invokes prior graph-transfer and algorithm results. Its completion section passes from averaged tree nonreconstruction to almost-every-fixed-tree nonreconstruction by monotonicity and bounded convergence. The formal scope note selects three-state supercritical reconstruction only. The reviewed challenge interfaces define multiset observations and averaged posterior advantage. Their intentional challenge placeholders do not constitute executed proofs. No nonreconstruction, graph consequence or four-state result acquires a verified formal badge from this inspection.
Four-state companions remain distinct
The regular/Poisson four-state paper assumes 0<=lambda<=1, the ferromagnetic regime. It claims nonreconstruction for d lambda^2<=1, including equality, for regular integer d>=2 and Poisson d>0. Here d is children per vertex or its mean, not total undirected degree. The Poisson expectation again includes extinction. Its preserved constraint is on distributions of posterior vectors; symmetry of an individual vector alone is not the required moment-saving hypothesis. The introduction explicitly distinguishes antiferromagnetic behavior.
The capacity companion concerns a bounded-degree deterministic infinite rooted tree and 0<lambda<1. It claims reconstruction iff L3 capacity is positive with path potential sum (lambda^(-2|e|) theta(e))^2. The square in the potential and the squared channel resistance both matter. At exponential critical growth, the complete tree geometry can matter beyond a scalar branching-rate test. The lambda=1 endpoint is explicitly excluded: an infinite ray retains the root perfectly while this capacity vanishes. The companion imports the preserved posterior-law inequality with cubic saving coefficient 1/1000; its certificate proof was not repeated or accepted here. These tree claims are not automatically four-community graph or real-network guarantees.
Implemented software contract
community_recovery_audit.py reads an explicit model declaration and exact rational rectangles for a,b. It reports whether the declaration matches the narrow graph corollary and computes the full minimum/maximum of S over that rectangle. The quadratic is convex, so its maximum is at a corner. Its two partial derivatives sum to -9, so a minimum is on an edge; the checker also considers stationary edge points a=b+3/2 and b=a+3. Corner-only minima would miss valid cases.
It reports an entire rectangle above threshold, an entire rectangle at/below, or a rectangle spanning the threshold. These are source-conditional statements about a declared model. It does not fit the model, check observations against it, authenticate declarations, or assign statistical coverage to supplied bounds. Correlated parameter uncertainty may make a rectangular enclosure conservative. If any part violates positivity, mean degree, finite edge-probability limits or the named label/graph/observation model, it declines to apply the corollary.
The utility also checks three-label score arrays, aligns the six label permutations, reports a constant-predictor baseline, and exactly enumerates iid uniform prediction baselines for at most eight vertices. Inputs are limited to 10,000 vertices, one MiB and 128-bit rational components. Larger exact null enumerations explicitly remain unknown. Duplicate keys, booleans in numeric fields, floats, nonfinite JSON, reversed intervals and extra fields are refused. Output files are fresh and carry input/checker hashes. These hashes bind bytes, not provenance or program correctness.
The finite-baseline trap
For truth labels [0,1,2], independent uniform predictions have expected best-permutation overlap 19/27, about 70.4%. The best match equals the number of occupied predicted labels divided by three; its expectation is 1-(2/3)^3. One-third is the limiting chance reference, not the exact finite-sample null after maximization. A constant predictor instead scores the largest true group fraction, which can exceed one-third because the labels are independently sampled.
An initial test mistakenly expected 2/3. The implementation returned the correct 19/27; the corrected independent occupancy calculation now passes. The failed expectation and original validator and partial outputs are preserved. No failed control is included as passing evidence. Exact finite baselines.
Preserved comparison with existing methods
The experiment contains 54 generated graphs: six parameter regimes, n=90/300/900 and three graph seeds per cell. Labels are sampled independently, then NetworkX's existing SBM generator draws edges conditional on the realized sizes. The generator is configured with arbitrary block sizes/probabilities and a seed. It includes planted node/block metadata; we explicitly remove all node, edge and graph attributes before the modularity algorithm runs. The preserved graph files retain truth solely for evaluation.
NetworkX 3.4.2 greedy modularity is forced to three groups using cutoff=3 and best_n=3. This can merge many components into one large group; one above-threshold 300-node case yields sizes 298,1,1. That selected recipe is not the source's threshold-achieving algorithm. A second conventional baseline uses the 2014 Bethe-Hessian construction: H(r)=(r^2-1)I+D-rA at both signs of r=sqrt(realized average degree), followed by clustering negative-eigenvalue vectors. It receives only n, edges and a numerical seed. We supply the known group count three, rather than estimate it from the spectrum.
The existing SciPy 1.18.1 eigensolver and kmeans2 supply numerical primitives. Six eigenpairs per sign are considered; the run refuses a fully negative six-value spectrum because additional negative vectors could be omitted. It uses cutoff -1e-8, residual tolerance 1e-6, twenty kmeans++ starts of 100 iterations, selecting minimum embedding inertia without consulting truth. The largest observed eigenpair residual was below 5.66e-10, with no k-means warnings. This is a finite floating implementation, not a proof of optimality or an implementation of the source's cited O(n log n) detector.
The default system scikit-learn import failed through its pre-existing SciPy binary; the bundled runtime has no scikit-learn. Both environments were preserved. The spectral comparison used the previously validated separate SciPy 1.18.1 environment, without installing or upgrading packages. Seeded generators use ordinary pseudorandom sampling and binary floating probabilities; their bytes and versions are retained, without asserting mathematical randomness or cross-version bitwise identity.
Each random-label mean uses twenty predictions per graph. The following means use three graphs per cell; they are not confidence intervals or an asymptotic experiment.
| Regime at n=900 | Spectral overlap | Forced-three modularity | Random labels |
|---|---|---|---|
| below | 35.81% | 35.04% | 35.39% |
| equality | 37.19% | 35.07% | 35.39% |
| above | 60.56% | 35.00% | 35.39% |
| strong assortative | 97.85% | 93.70% | 35.39% |
| negative equality | 35.89% | 34.52% | 35.39% |
| negative above | 58.74% | 34.78% | 35.39% |
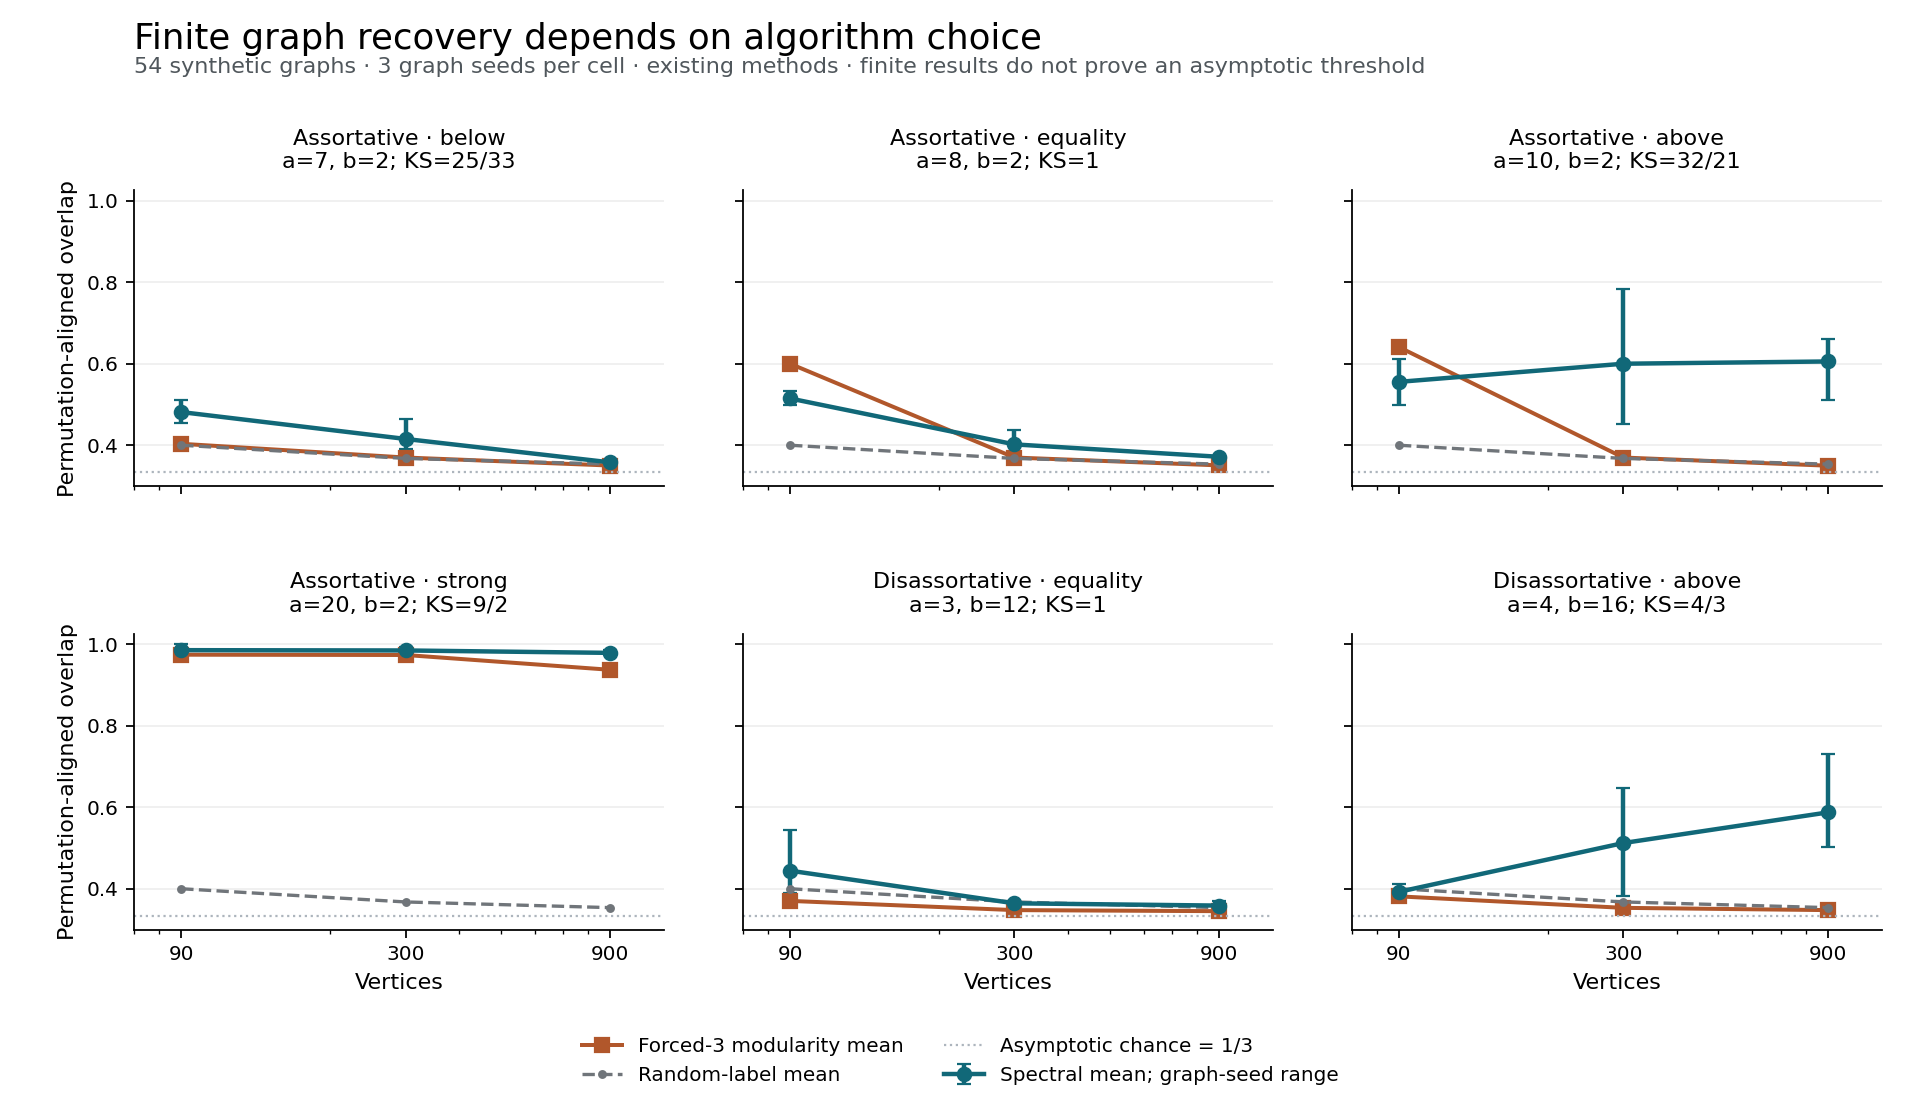
Spectral error bars show the minimum-to-maximum of the three graph-seed scores. They are sample ranges, not confidence intervals. The first plot layout is preserved alongside the improved layout; data did not change. Vector figure, all original graphs, labels and modularity results, spectral predictions, eigenpairs, clustering diagnostics and graph hashes.
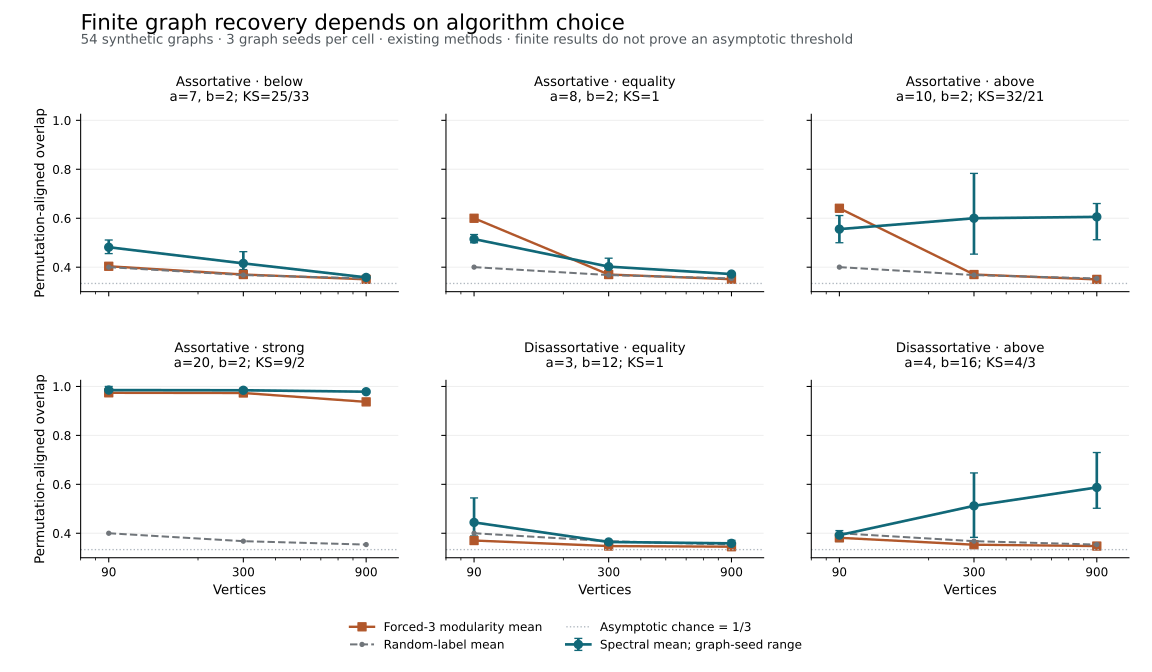
These observations make the algorithm/model distinction concrete: a weak selected modularity recipe can fail on above-threshold data, while an existing spectral construction recovers useful overlap on the same graphs. Conversely, noticeable finite overlap at equality does not refute an asymptotic limit. Small samples, one fixed spectral recipe and no real-world data cannot validate the theorem or commercial advantage.
Evidence and business decision
886 exact-contract/benchmark controls include 729 exact rectangle comparisons with a complete half-grid oracle, scope/refusal boundaries, null-label identities and metadata-free graph inference. 162 spectral controls check finite outputs, numerical residuals and truth-independent inertia selection. Total new controls: 1,048. Full source native certificates, Lean kernels, held-out model fit, realistic misspecification robustness, customer studies and profitability remain unverified.
Selected reading covers the complete three-state introduction/conclusion, two challenge interfaces and the scope note; the complete four-state introduction; and capacity-source lines 1-340. Six PDF pages were visually inspected. Three-state replay instructions require 37 successful subprocess records plus separate interval sanitizer checks; the four-state lightweight verifier does not repeat the full C++ traversals. None of those source programs ran here. Exact reading ledger and artifact/source manifest.
Potential use: integrate a benchmark report into a graph analytics team's evaluation pipeline, preserving data-generation assumptions, estimator access, finite nulls, algorithm selection and model uncertainty. The new result sharpens a model-level feasibility boundary; it does not invent the existing clustering methods. Earlier AUD 4,000-12,000 assessment and AUD 400-1,500/month hypotheses lack buyer evidence. Keep this below facility review in the build queue. Before a standalone product, establish a recurring workflow where these checks prevent material mistakes beyond current libraries; supervised tasks and badly fitting networks should not inherit the unsupervised theorem verdict.